Quickstart#
Broadly speaking, Compass takes in a gene expression matrix scaled for library depth (e.g., CPM) and outputs a reaction score matrix, where higher scores correspond to a reaction being less likely.
Note
Reaction scores are only comparable across different samples for a given reaction. Please note that the magnitude of reaction scores differs significantly between reactions, therefore one should not compare reaction scores between reactions for a given sample.
Input Data#
The input gene expression matrix can be a tab-delimited text file (tsv) or a matrix market format (mtx) containing gene expression estimates (CPM, TPM, or similar scaled units) with one row per gene, one column per sample. We also support AnnData objects as input.
Tab-delimited files need row and column labels corresponding to genes and sample names.
Market matrix formats need a separate tab delimited file of gene names and optionally a tab delimited file of cell names.
AnnData objects should contain normalized counts in the adata.X slot.
Example Input#
You can find example inputs in tab-delimited format (tsv) and market matrix format (mtx) on this github repo under compass/Resources/Test-Data.
These files will exist locally as well under the Compass install directory which can be found by running:
compass --example-inputs --species homo_sapiens
Human or mouse species makes no difference for this command.
Running Compass#
After opening a command line in a directory with an input file expression.tsv,
you can run Compass on the data with the following command, which will limit the number of processes used to 10:
compass --data expression.tsv --num-processes 10 --species homo_sapiens
To run Compass on mtx formatted data, use the following command:
compass --data-mtx expression.mtx genes.tsv sample_names.tsv --num-processes 10 --species homo_sapiens
To run Compass on AnnData objects, use the following command:
compass --data anndata_object.h5ad --num-processes 10 --species homo_sapiens
Though the sample names file can be omitted, in which case the samples will be labelled by index.
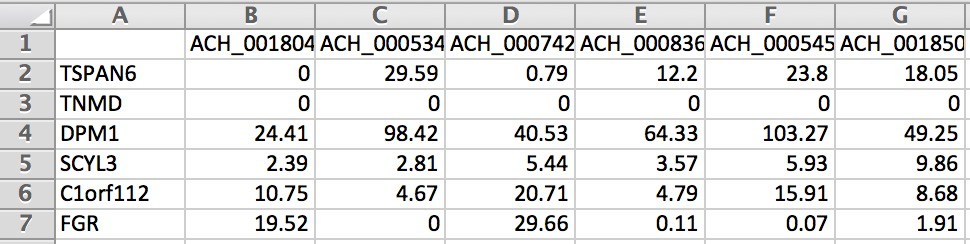
Below is an example of the formatting for gene expression (we only show a small portion of the matrix):
For the first run of Compass on a given model and media there will be overhead building up the Compass cache. Compass will automatically build up the cache if it is empty, but you can also manually build up the cache before running Compass with:
compass --precache --species homo_sapiens
Note
For every individual sample, Compass takes roughly 30 minutes to calculate the reaction penalties (varying by machine). This can be expedited by running more than one process at once. In addition, Compass saves the results of all samples that it has already processed in the _tmp directory. Therefore, Compass can also be stopped and restarted after it is done processing a subset of samples so long as the _tmp directory is still there.
For an in-depth explanation of the various Compass parameters, see here.
Output#
When Compass has completed, the outputs for all samples are stored in a tab delimited file reactions.tsv in the specified output directory (. directory when running Compass by default).
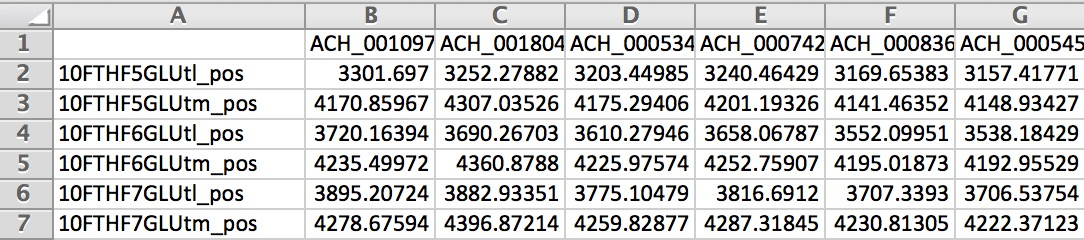
Below is an example of the output matrix:
To get more context on what the RECON2 reaction identifiers are, you can visit virtual metabolic human or the resources directory of Compass where there are several .csv files which include information on the reactions in Recon2.
If you are using Human1 or Mouse1, you can visit Metabolic Atlas to view the metabolic network.
Note
While Compass is running, it will store partial results for each sample in the _tmp directory (or the directory following –temp-dir)
Postprocessing#
Once Compass has finished running, we apply several steps of postprocessing to the data. More specifically, postprocessing converts reaction penalties (where high values correspond to low likelihood reactions) to reaction scores (where high values correspond to likely reactions). Refer to this page of the documentation for an example notebook.